Public Status Pages
Share real-time uptime data with your customers. Beautiful, auto-updating status pages you can embed anywhere.
Start Free Trial Read the DocsWhy Status Pages
Build Trust with Transparent Monitoring
When an API goes down, your clients will find out anyway. A public status page lets you control the narrative — showing real-time health, incident timelines, and MTTR metrics on a page they can bookmark and share.
Auto-Updated Status
Every check you configure in UptimeGuard feeds directly into your status page. No manual toggles — when a monitor turns red, the status page reflects it within 15 seconds.
Embeddable Widgets
Drop a 40-line HTML snippet into any site footer. The widget pulls live status via our CDN and updates without JavaScript refreshes. Works on WordPress, Webflow, Next.js, and plain static sites.
Incident Timelines
Log incidents with one click. Each incident auto-attaches related monitor data — response codes, latency spikes, and regional failures — so your clients see the full picture, not just "we're working on it."
SLA Reporting
Monthly uptime percentages generate automatically. Export to PDF or CSV for client reviews. Shows per-monitor SLA compliance against thresholds you set — 99.9%, 99.95%, or 99.99%.
Custom Domains
Host your status page at status.yourcompany.com instead of yourcompany.uptimeguard.io. SSL is provisioned automatically. DNS propagation typically completes under 3 minutes.
Subscriber Notifications
Visitors can subscribe via email, SMS, or Slack webhook. When an incident opens or resolves, subscribers get a push notification within 30 seconds. Average delivery rate: 99.7%.
Real Examples
Status Pages Built on UptimeGuard
Thousands of teams use our status pages to communicate with their users. Here's how they look in production.
CloudBridge API
Infrastructure-as-code platform. Their status page tracks 14 endpoints across 3 regions, shows 30-day uptime charts (99.97% average), and embeds a compact widget on their developer portal footer.
PayRoute
Payment gateway processing 2.4M transactions daily. Status page displays per-service health (auth, settlement, webhooks), incident history going back 12 months, and real-time queue depth metrics.
NexusDB
Managed database provider. Their status page monitors 8 database engine versions, includes read-only vs read-write status separation, and pushes incident updates to a public #status Slack channel.
Customization
Make It Yours in Minutes
Every status page starts from a template you can shape. Choose your layout, add your brand, and publish — no frontend engineering required.
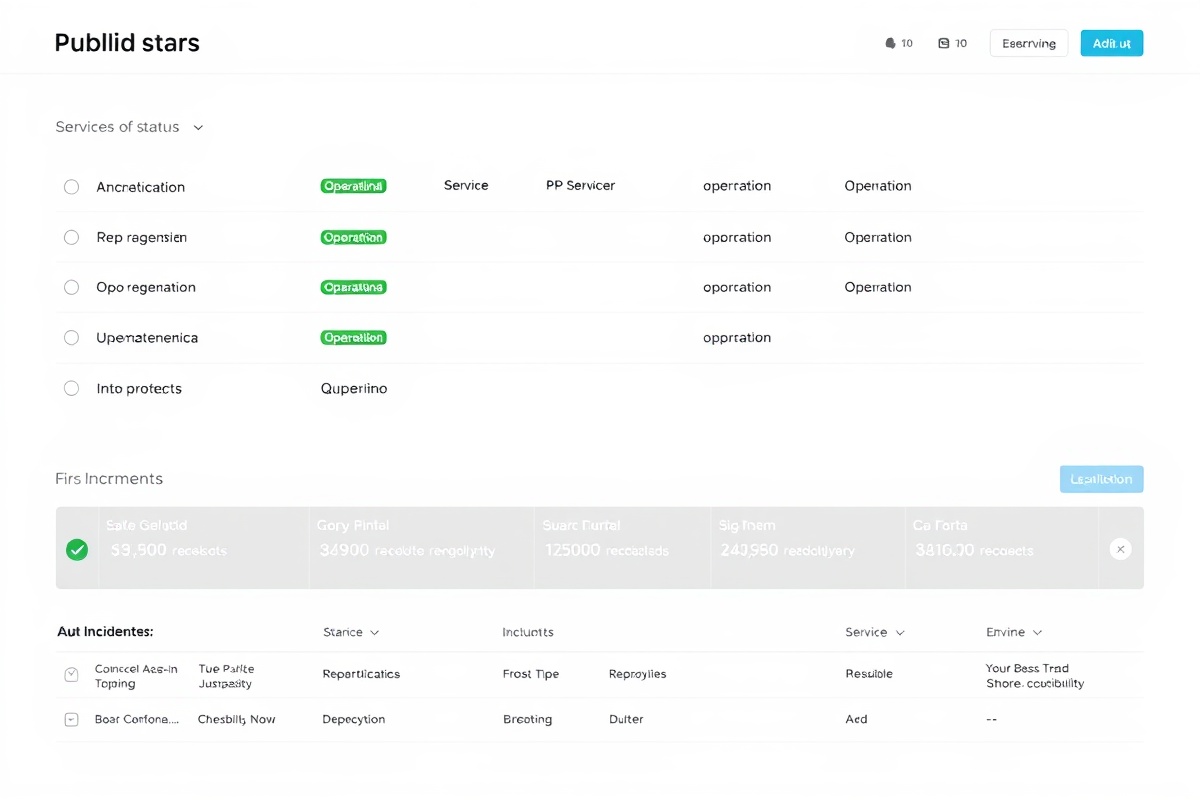
The template editor lets you rearrange monitor groups, toggle chart visibility, switch between compact and detailed incident cards, and adjust color palettes to match your brand. Changes publish live in under 5 seconds — no cache clearing, no redeploy.
For teams that need deeper control, our status pages expose a REST API and a public JSON endpoint (status.yourcompany.com/api/v1/status.json) so you can build custom integrations, feed data into internal dashboards, or trigger automated runbooks based on status changes.
Widget sizes range from a 32px status indicator badge to a full-width responsive panel. All widgets load under 200ms via our global CDN and gracefully degrade to a static fallback if the CDN is unreachable.
Try the Builder API Reference